Jaeseon Song
I explore human vision and audition through psychophysics and fMRI. My study is driven by a quest to understand how we perceive and interpret the world.
Vision Scientist
Skills
- Software: Python, MATLAB, R, SAS, SPSS
- Hardware: Eye trackers (EyeLink 1000+, Pupil-labs core eye-tracking headset), Spectrophotometer (Photo Research PR-650)
Employment
Postdoctoral Researcher, Psychological & Brain Sciences | The University of Delaware (August 2024 - Present)
Education
-
Ph.D., Psychology The University of Georgia (August 2024) -
M.S., Psychology Chungbuk National University (February 2015) -
B.S., Psychology Chungbuk National University (February 2013)
Research Projects
1. The effect of Fast Flicker Adaptation on Contrast Discrimination (Dissertation)
My dissertation dives into interactions between the spatial and temporal domains of the visual system. My experiments delve into Fast Flicker Adaptation (FFAd) and its impact on resolving fine details in static objects. I focus on the magnocellular (M) pathway, hypothesizing its crucial role in processing fast flickering and detailed imagery. My experiments span across three areas: examining contrast responses under varying contrasts of adapting flicker, understanding the influence of spatial frequency (details) in flickering stimuli, and analyzing the effects of different flicker speeds.
-
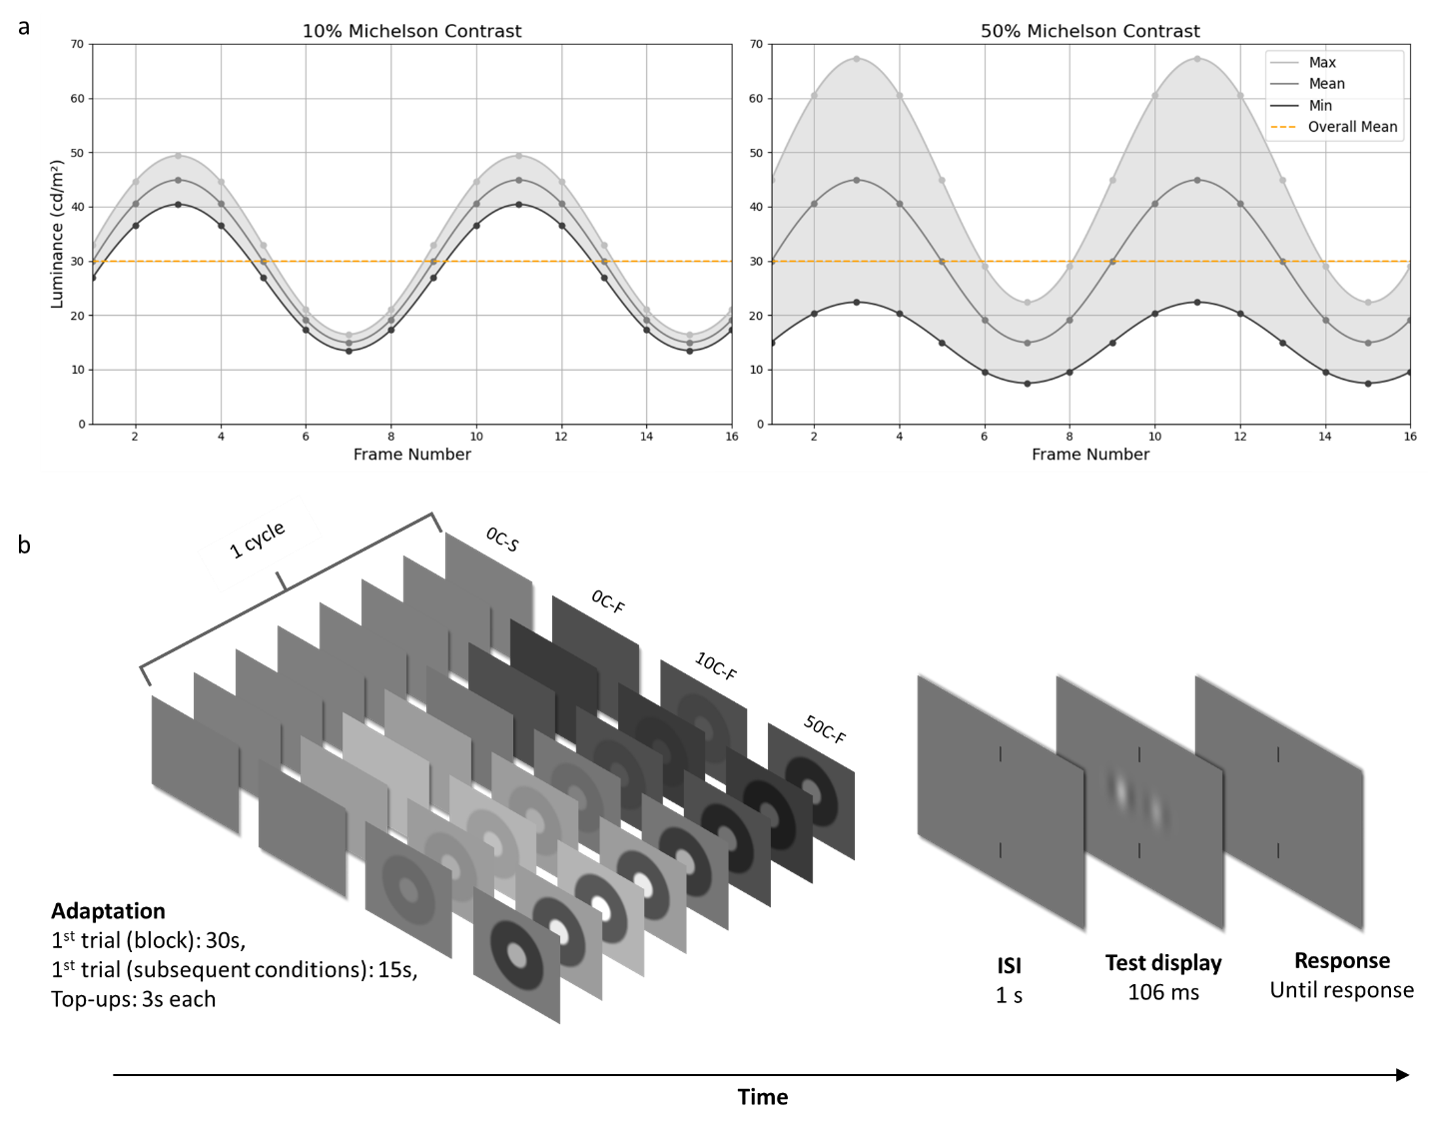
Adaptation Stimuli and Procedure used in Exp1
-
(a) Brightness Profiles over 2 cycles for conditions for conditions 10C-F (10% Michelson contrast, left) and 50C-F (50% Michelson contrast, right) with a 50% temporal modulation on an 85 Hz monitor.
-
(b) Procedure: each session begins with a 30-second adaptation to 1 of 4 contrast conditions, depicted through 8 images. Subsequent trials involve a 3-second adaptation, except the first trial of a new condition, which has a 15-second adaptation. After each adaptation, there’s a 1-second pause with an auditory cue before presenting the test stimulus for 106 ms. Participants then choose which of the two displayed Gabor patches (sinusoidal gratings) has higher contrast, using a two-alternative forced choice (2AFC) method.
-
Watch Videos: 


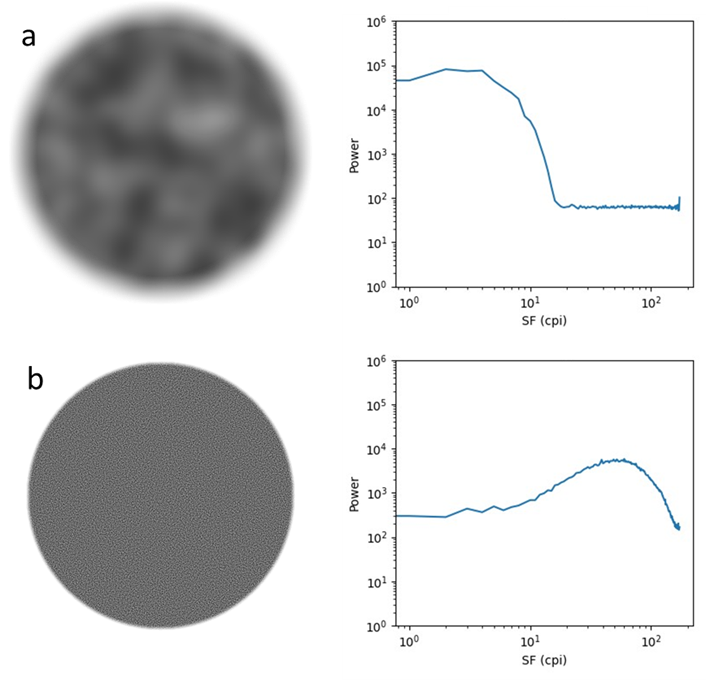
- Stimuli used in Exp2
-
(a) Adaptation stimulus with Gaussian low-pass filtering (top left) and its corresponding power spectrum (top right), which peaks at frequencies below below 15 cycles per image (cpi, 2 cycles per degree (cpd)).
-
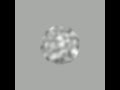
(b) Adaptation stimulus with band-pass filtering (bottom left) and its corresponding power spectrum (bottom right), peaking at around 50 cpi (6 cpd), illustrating the targeted spatial frequency ranges for this test.
Watch Videos: 
- Stimuli used in Exp3
Watch Videos: 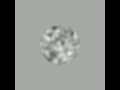
2. Examining Increment Thresholds as a Function of Pedestal Contrast under Hypothetical Parvo- and Magnocellular-biased Conditions
In our recent studies, we challenge existing views on how our visual system processes contrast and color. Traditionally, it was believed that two testing methods, the pulsed- and steady-pedestal paradigms, could separately measure the responses of the parvocellular (P) and magnocellular (M) systems in our eyes. These systems help us perceive largely details and movement, respectively. We investigated these methods by examining how well we can detect changes in contrast, especially under different light and color conditions. Surprisingly, our results showed that color doesn’t affect how we see contrast as much as previously thought, and that spatial frequency has minimal impact. Using a mathematical model, we found that both testing methods seem to measure the P-system more than the M-system.
-
Song, J., Breitmeyer, B. G., & Brown, J. M. (2023) Examining increment thresholds for Gabor patches under hypothetical parvocellular- and magnocellular-biased conditions. Attention, Perception, & Psychophysics. See Publication
-
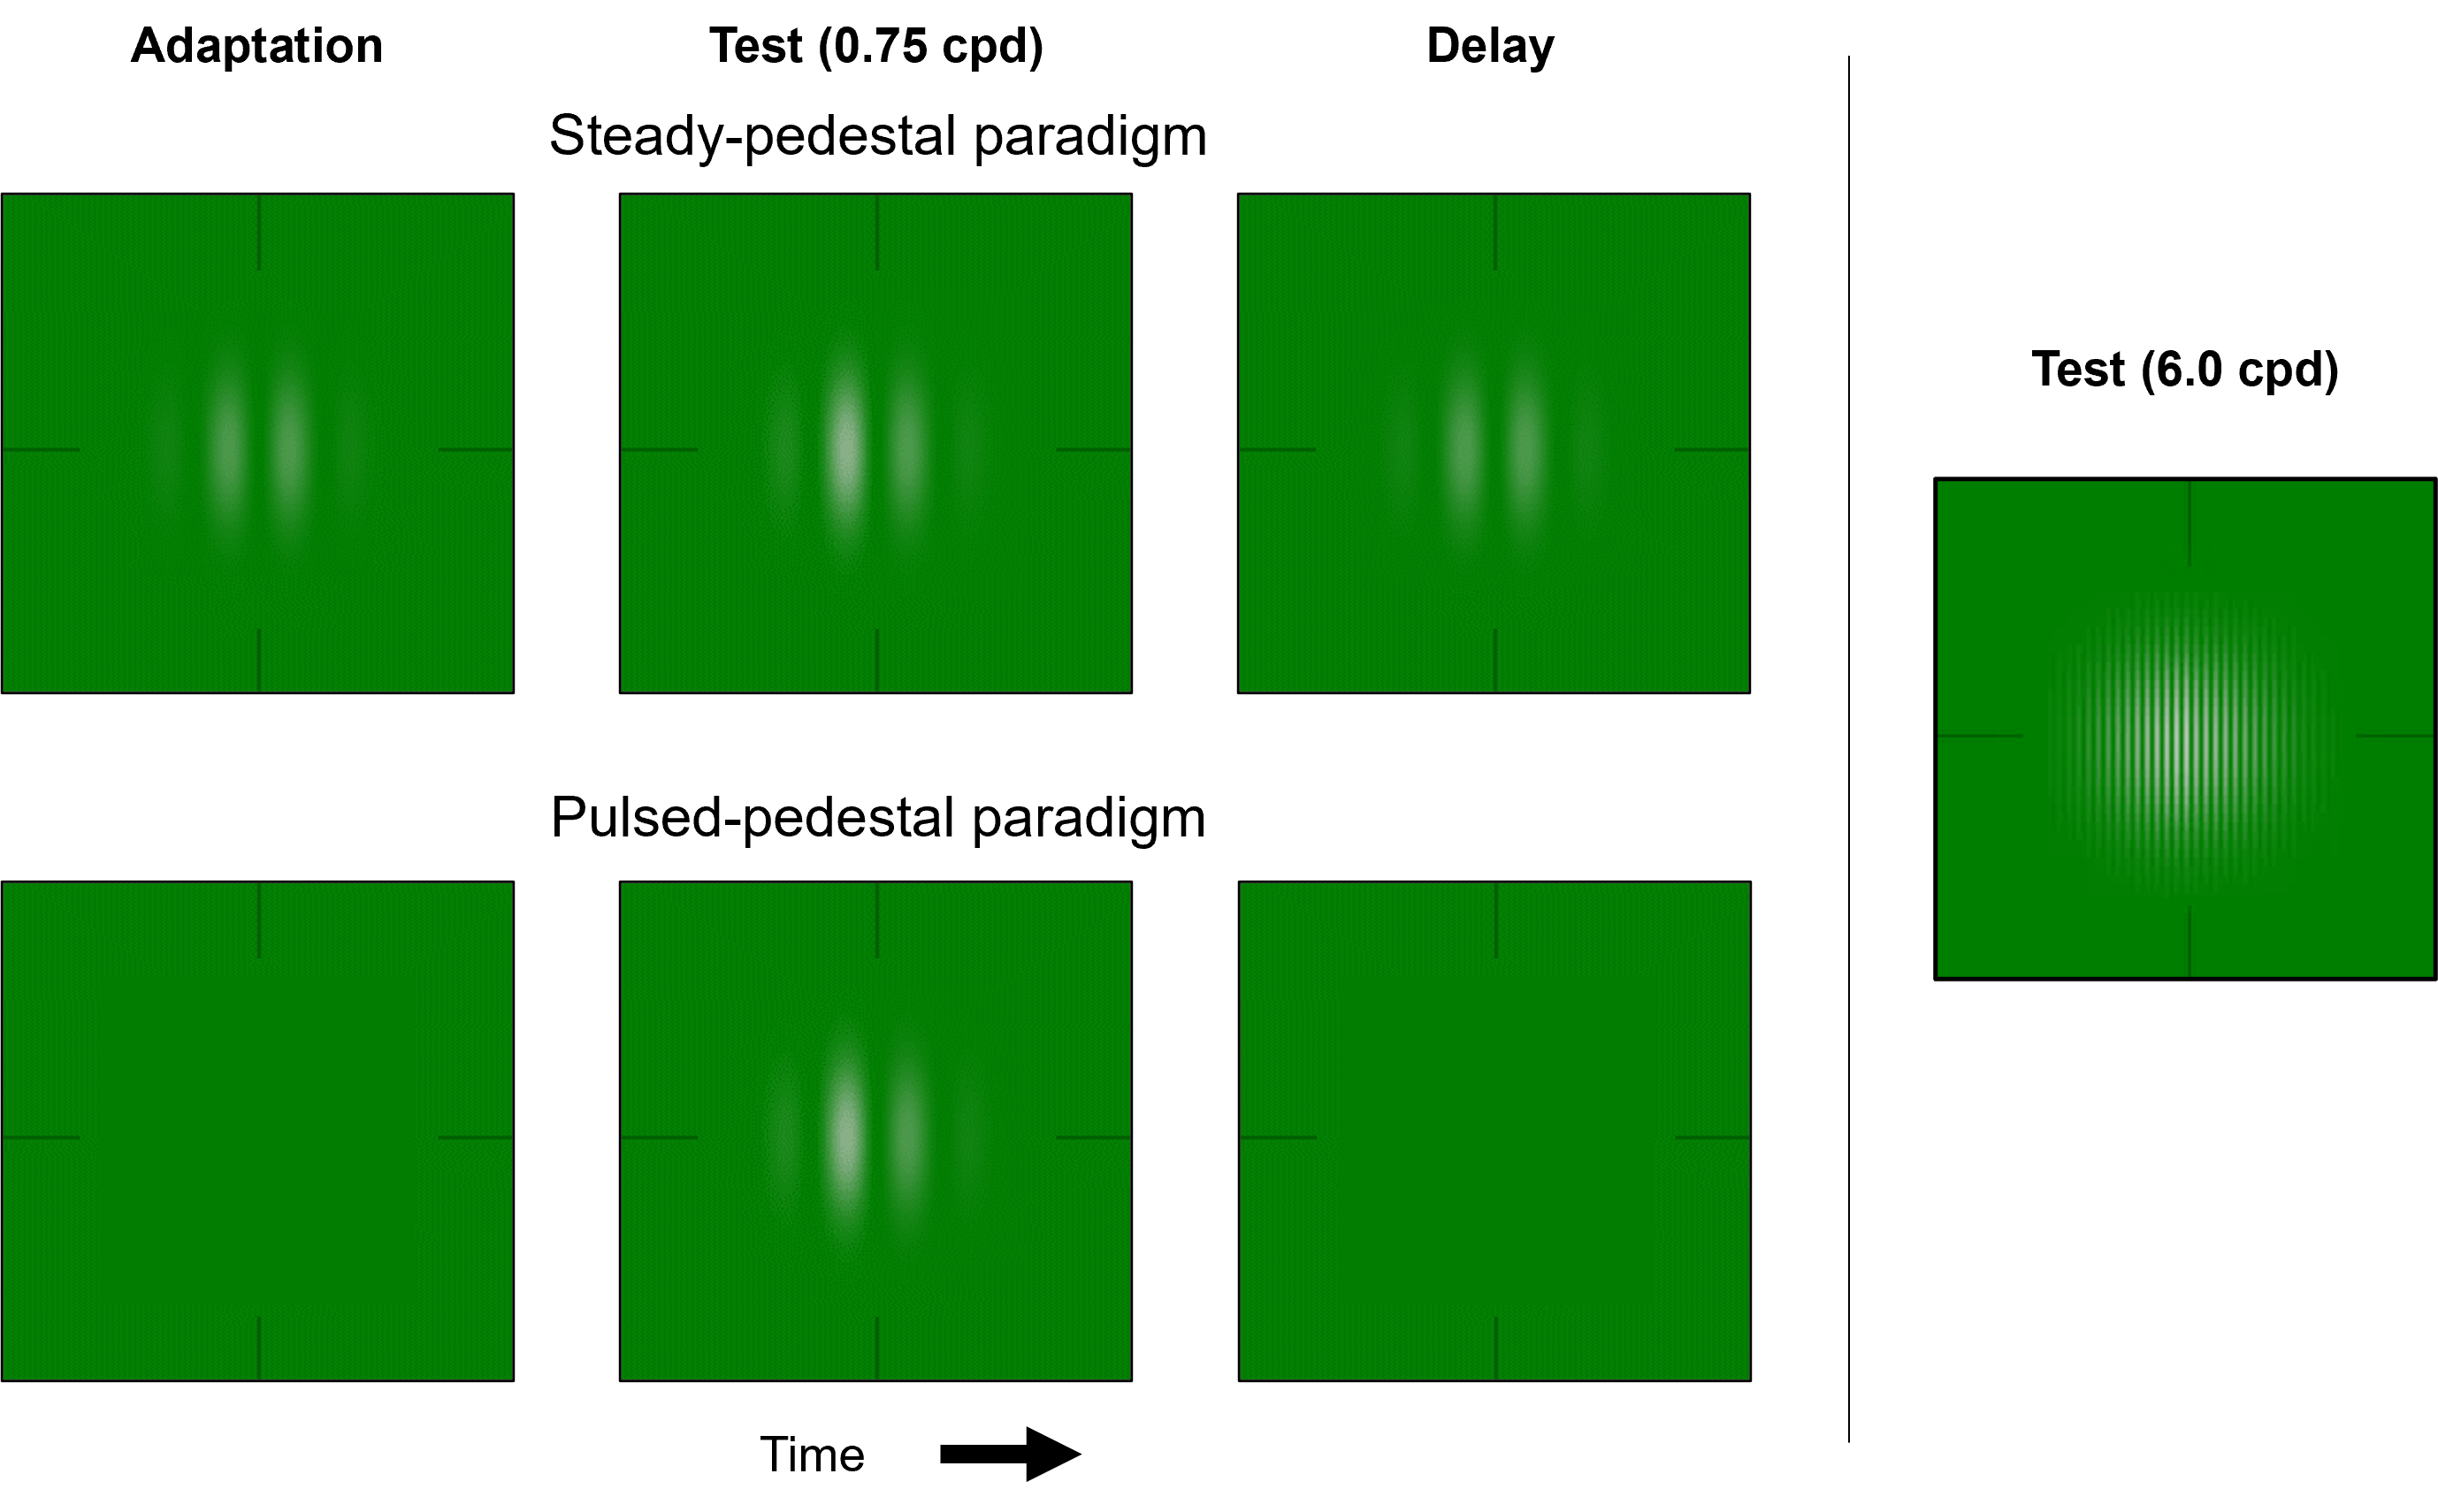
Procedure and Stimuli
- The steady- and pulsed-pedestal paradigms for the 0.75 cpd (cycles per degree) condition (left) and an example of 6.0 cpd condition during the test interval (right). For the steady-pedestal paradigm (top row), a 6° Gabor patch (sinusoidal grating, Gaussian-windowed) pedestal was presented continuously in the center of a constant surround. One half was randomly chosen to have an increment in luminance contrast (while the color contrast remained unchanged) and to serve as the test half while the other half served as the reference half. During the test interval, the contrast incremented test half was presented briefly. For the pulsed-pedestal paradigm (bottom row), the participant first adapted to the surround luminance, then during the test interval both the test half and the reference half were presented simultaneously. Gabor patches and background were either red or green.
-
- Song, J., Breitmeyer, B. G., & Brown, J. M. (Manuscript Under Preparation) Further examination of the pulsed- and steady-pedestal paradigms under hypothetical parvocellular- and magnocellular-biased conditions. See Abstract
3. The influence of “advancing” and “receding” colors on figure-ground perception under monocular and binocular viewing
This study focuses on figure-ground perception, challenging the widely accepted idea that chromatic aberrations are the sole cause of red images appearing nearer or as the figure. I believe that a more comprehensive understanding of low-level optical and high-level cognitive processes involved in figure-ground/depth perception is necessary to fully account for this perceptual bias.
-
Song, J., & Brown, J. M. The influence of “advancing” and “receding” colors on figure-ground perception under monocular and binocular viewing. Attention, Perception, & Psychophysics (2nd revision). See Abstract
-
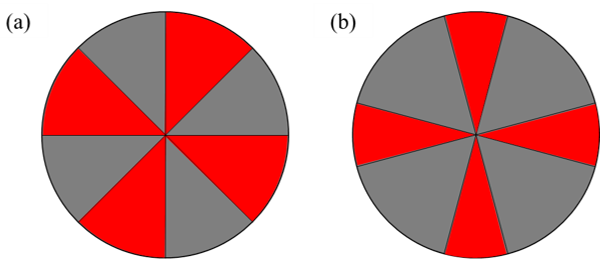
Examples of the Red vs. Gray conditions in Exp1 and Exp2. In Exp1, we used Maltese crosses that were figure-ground ambiguous, consisting of left- and right-tilting sectors of equal area. In Exp2, the two crosses were figure-ground biased, consisting of a Plus (+) shaped cross of smaller sectors, presented at cardinal (vertical and horizontal) orientations, biased to be seen as figure, and an X-shaped cross of obliquely oriented larger sectors, biased to be seen as ground.
-
(a) An example of the ambiguous Maltese crosses pattern used in Exp1 consisting of two regions—the “rightward tilted cross” and the “leftward tilted cross.” Right and left refer to the location of the top of the cross with respect to the center of the pattern. Each of the two regions of the Maltese crosses pattern consisted of four nonadjacent octants of a circular region.
-
(b) An example of the figure-ground biased Maltese crosses pattern used in Experiment 2 consisting of two regions—the smaller, “Plus-shaped cross,” presented at cardinal orientations, and the larger “X-shaped cross,” presented at oblique orientations. The Plus-shaped cross was biased to be seen as figure, while the X-shaped cross was biased to be seen as ground.
-
-
Work Experience
Graduate Teaching Assistant @ University of Georgia (August 2017 - Present)
- Instructor of Record
- Research Design in Psychology (PSYC 3980) – Summer 2022
- Designed and built all curriculum for research design (junior-level) course intended to aid students in evaluating the qualities of multiple sources of information by considering alternative explanations and determining the truth/falsity of assumptions.
- Sensation and Perception (PSYC 4120) – Fall 2020
- Designed and built all curriculum for sensation and perception (senior-level) course intended for students gaining a general understanding and appreciation of their sensory/perceptual systems.
- Research Design in Psychology (PSYC 3980) – Summer 2022
- Teaching Assistant
- Sensation and Perception (PSYC 4120) – Spring 2023
- Research Analysis in Psychology (PSYC 3990) – Fall 2022, Spring 2021
- Teach/taught weekly lab section (using R software) for junior-level course.
- Collaborated with multiple teaching assistants and instructor to design rubrics for the evaluation of research papers and assignments.
- Research Design in Psychology (PSYC 3980) – Spring 2022, Summer 2021, Spring 2020, Fall 2019
- Psychopharmacology (PSYC 5850) – Fall 2021
- Elementary Psychology (PSYC 1101) – Spring 2019
![]()